Proud champions of the UK offshore energies sector
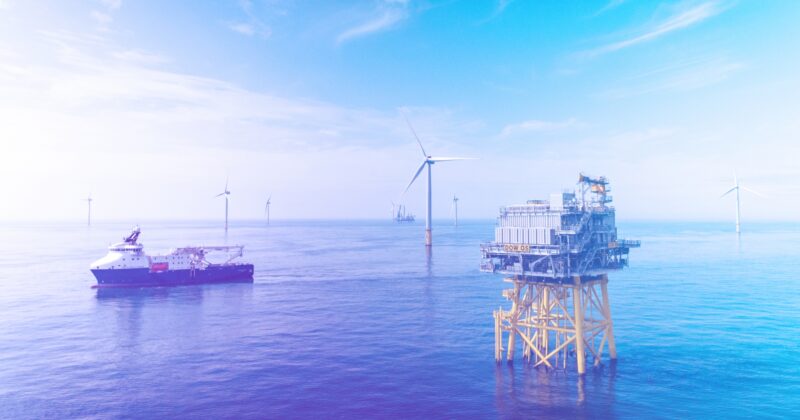
Working together, producing cleaner energies
Delivering a thriving UK powered by homegrown energy that’s produced safely and sustainably.
The voice of
the UK offshore
energy
sector
We are the leading representative body for the UK’s offshore energy industry, giving a voice to over 400 organisations and businesses throughout the country. Our membership is open to all companies from the largest producers and developers, to contractors, consultancies and the smallest start-ups.
Our industry
manifesto
The UK offshore energy sector is essential for the economic and environmental prosperity of our country.
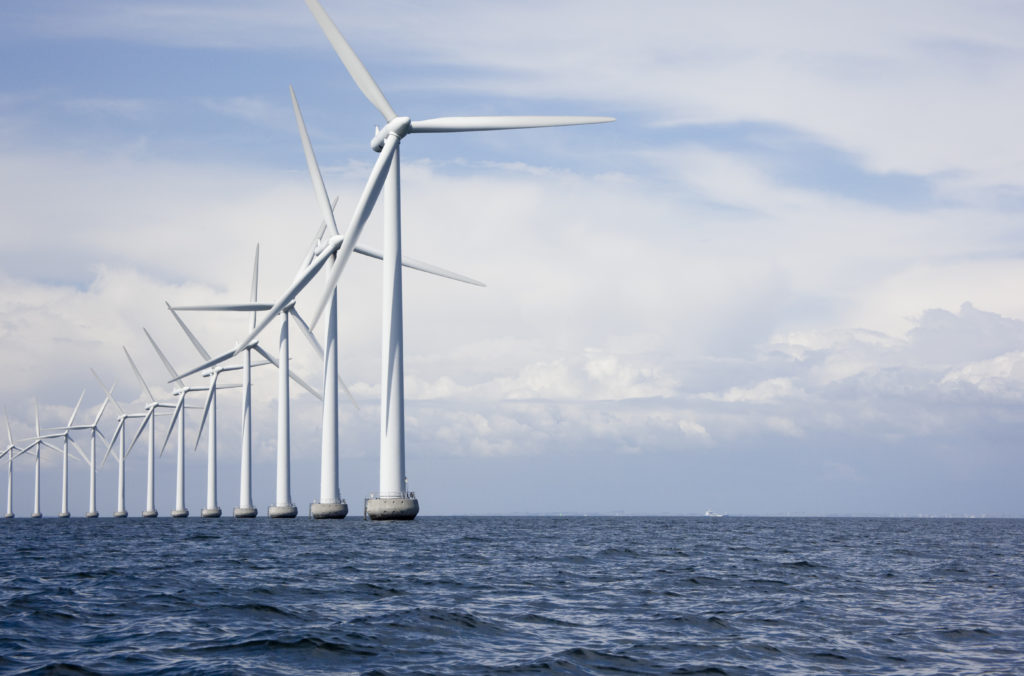
Our brilliant, skilled people work tirelessly to produce the energy from off the coast of Britain that powers not just our homes, transport and industry, but the everyday products we need to live well.
We are proud to make a huge contribution. Oil and gas production alone added over £20 billion to the UK economy in 2022/2023. The offshore energy industry provides over 200,000 good, skilled jobs across the length and breadth of the UK. We provide secure and reliable energy to millions.
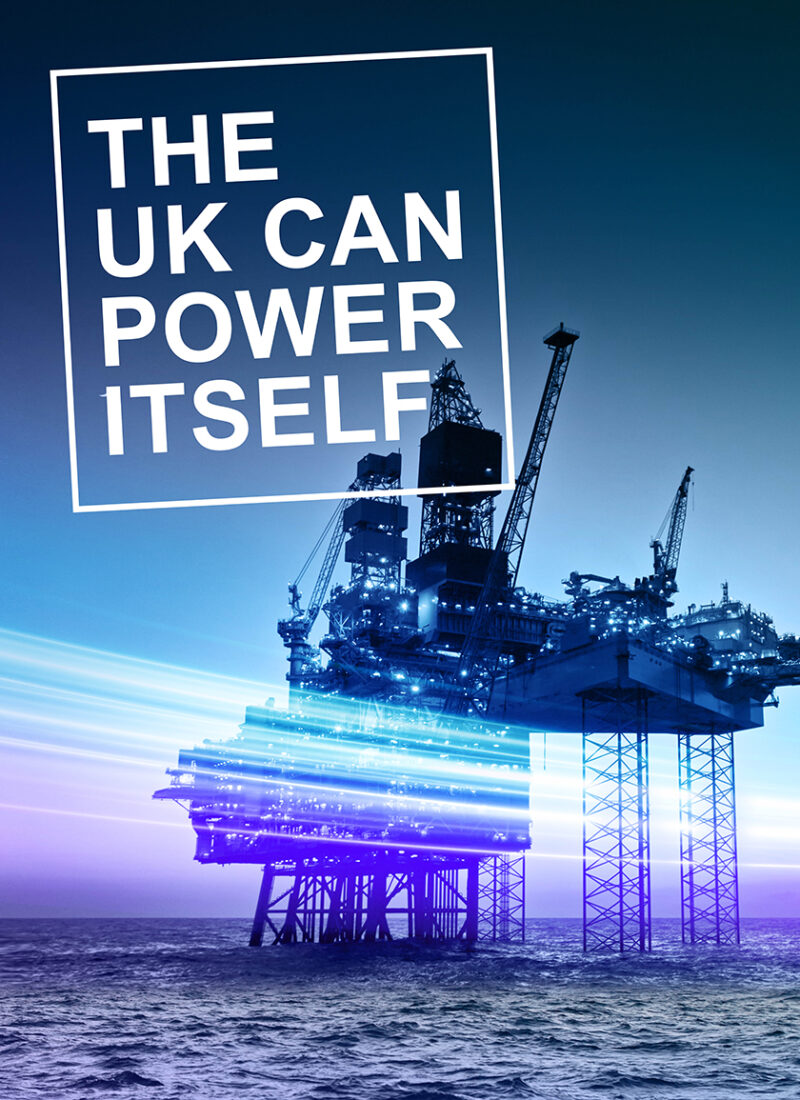
By choosing a homegrown energy transition, we can protect skills, secure investment and maximise sustainability.
More from OEUK
- News
- Events
- Campaigns
- Consultations
- Publications


Become a member of Offshore Energies UK
Our members benefit from value adding insights, targeted networking, profile raising opportunities and reduced costs for OEUK events. We work closely with you to understand your business goals, providing tailored support to help you maximise your membership.
We give a voice to over 400 businesses working in or providing services to the UK offshore energy industry.